01
Colorado State University
Tofu
Ingredient, production and ordinary tofu as a non-fermented food. The source marks some content “Pending External Review”; it is used here for basic process information.
THE EVIDENCE
The references behind the ingredient,
the process and the crop.
Sources checked September 16, 2026
PART OF THE WHY / SEPTEMBER 2026
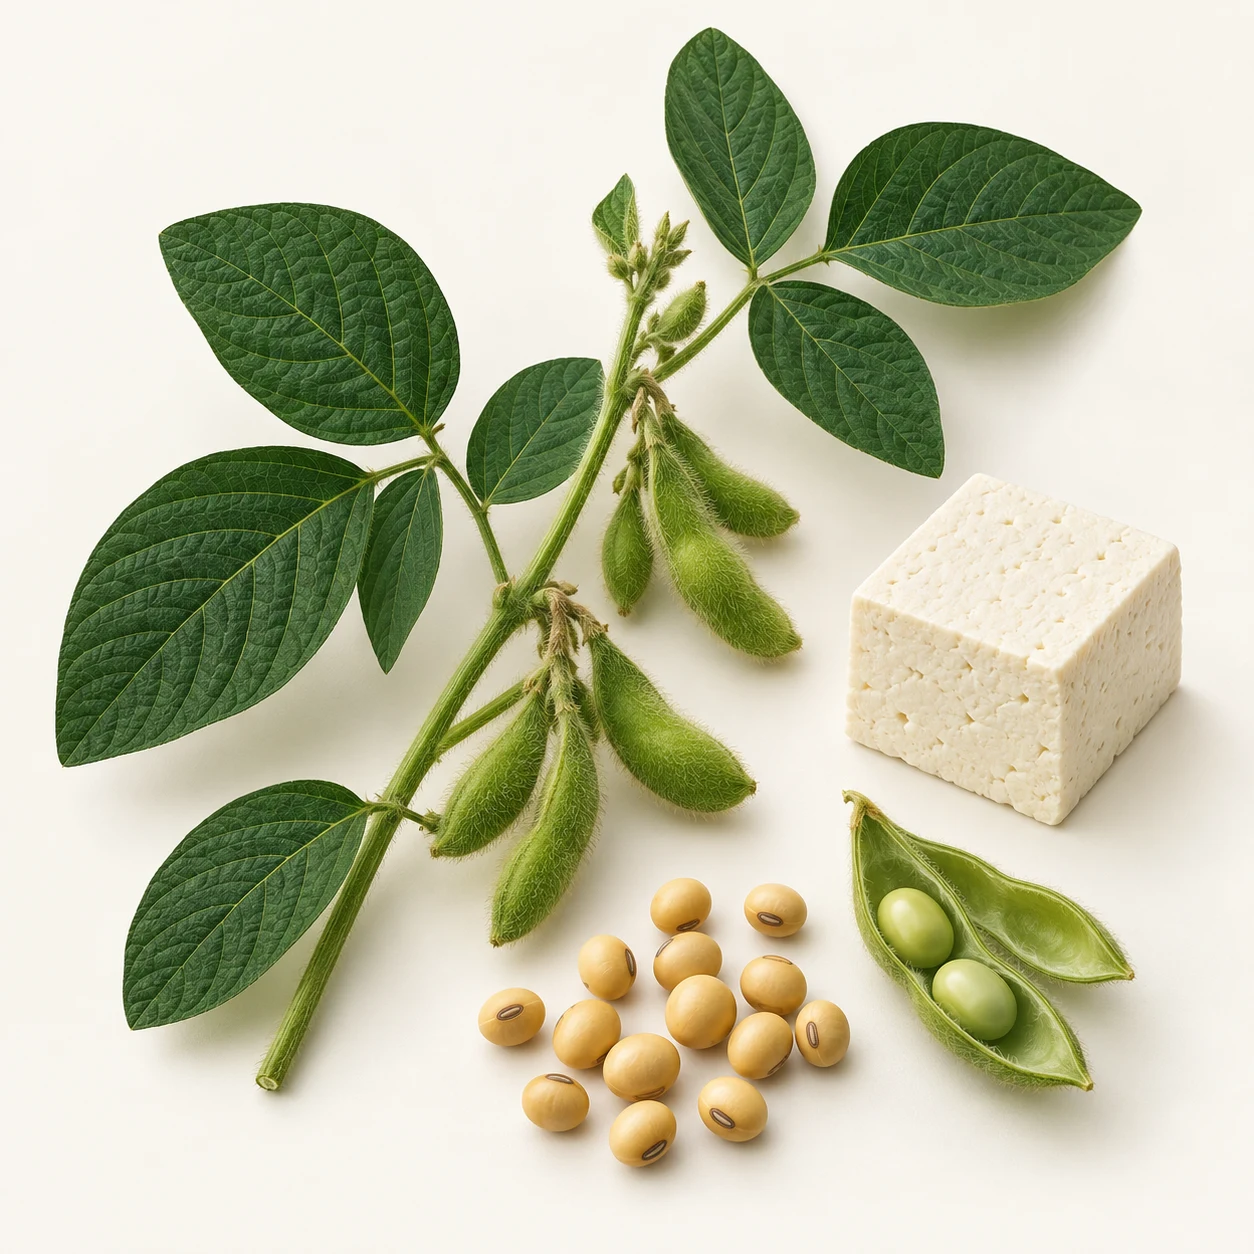
Soybean foods offer a more direct route from crop to plate. Replacing some meat with tofu can substantially reduce food-related emissions and land use.
| Food | kg CO2e | Tofu is lower by |
|---|---|---|
| Tofu | 2.0 | Reference |
| Poultry | 5.7 | 65% |
| Pork | 7.6 | 74% |
| Beef, dairy herd | 16.9 | 88% |
| Beef, beef herd | 49.9 | 96% |
Rounded global means from Poore & Nemecek (2018), Data S2 (XLS). Equal protein, not equal food weight. CO2e combines greenhouse gases into a common measure. Percentages use unrounded values.
If one million Americans replaced a poultry portion supplying 25 grams of protein with tofu once a week for a year, these averages imply about 48,000 metric tonnes of CO2e lower annual supply-chain emissions.
Our illustration, not a U.S. forecast: (5.6986 − 1.975) × 25/100 × 52 × 1,000,000 ÷ 1,000. Assumes replacement, not extra food; excludes wider market responses.
Food-grade soybeans are selected and handled for food makers’ requirements, including protein, flavor and traceability. Soybean meal used in livestock feed is a co-product of oil extraction. The environmental comparison concerns food-production pathways; bean grade alone does not establish an environmental benefit.
University of Minnesota Extension · 2022
USDA ERS · Soybean meal and oil markets
These historical global averages cover production through retail. The underlying studies were published in 2000–June 2016, with observations centered around 2010. Cooking and household waste are excluded. Products and producers vary; tofu’s factor does not describe every soy food. Equal protein is not complete nutritional equivalence.
Estimating an actual U.S. transition would require U.S. sourcing, diets, adoption and replacement data. Supporting American growers is our mission; U.S. origin alone is not proof of a lower footprint.
Study scope and methods · Supplementary materials (PDF)
Download the one-page reportAn independent American Soybean Co. / USA TOFU summary. Cited researchers and institutions are sources, not campaign endorsers. Read our mission ↗
Each state page uses USDA NASS 2025 crop-year survey estimates, checked September 17, 2026. These figures cover the whole soybean crop, not just food-grade beans. Local extension references appear alongside the claims they support.
Colorado State University
Ingredient, production and ordinary tofu as a non-fermented food. The source marks some content “Pending External Review”; it is used here for basic process information.
USDA Economic Research Service
U.S. soybean agriculture and the broader meal and oil markets.
University of Minnesota Extension
Food-grade soybean supply chains. Published June 9, 2022; historical acreage shares are not presented as current figures.
University of Minnesota Extension
Edamame as vegetable soybeans harvested green.
U.S. Department of Agriculture
Page 1-4 lists tofu among protein-food choices. This guide is written for Child Nutrition Programs; product-specific nutrient information still belongs on the label. Checked September 17, 2026.
U.S. Food & Drug Administration
Product-specific nutrient information and consistent serving-size comparisons.
USDA National Agricultural Statistics Service
Dated soybean acreage and production. This is a dynamic table; the figures on this site were checked September 16, 2026.
Dates, geographic scope and product-specific differences matter. Campaign language is explained alongside the underlying facts.
These sources provide evidence. Their authors and institutions are not presented as campaign sponsors or endorsers.
Suggest a source or correction ↗